I am oh so very close to the finish line of the Masters of Information in Data Science at UC Berkeley and in between battling CUDA ‘Out Of Memory’ errors and underperforming neural networks, I’ve been thinking a little bit about what brought me to this point. Throughout the program people have been asking me why I’m doing this degree and what I want to do afterwards. When I tell my professors and classmates that I’m a designer they tend to assume that I’m looking to transition out of doing design work and get a job with a title like “Data Analyst”. My friends and coworkers are curious but probably a little puzzled since I already have a fairly well-defined career. My family has known me too long to bother asking questions. And to be fair my own answers to “Why?” and the “What next?” are quite different now than they were at the beginning of this program two years ago. The kernel of what brought me here though hasn't changed. I’m going to keep designing and being a designer, I've just realized that data and data literacy is an important part of designing at scale.

Qualitative research isn’t the opposite of quantitative research, it’s a powerful complement to it.
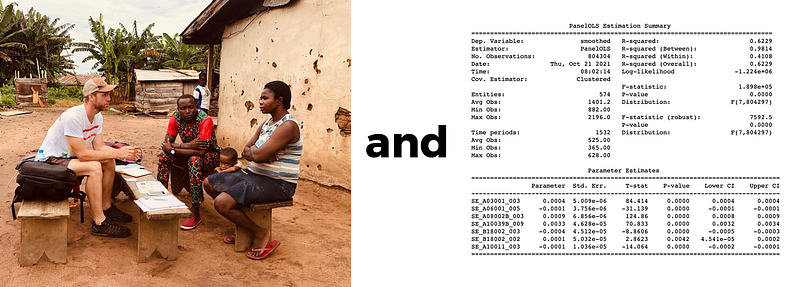
When I worked at IDEO.org my first project was helping to design ways to educate adolescent girls in rural Kenya about contraceptives and ensure that they had access to free reproductive health services. And figuring out how to do that was a process of understanding a lot of interrelated and unanticipated aspects of life in villages, Kenyan cultures, and reproductive health. To design something as complex as a curriculum, a service, and an outreach campaign meant that we needed to design a system rather than a product or even a service. We talked to a few dozen people in a few different places, we took lots of photos, we wrote down lots of quotes. When the program rolled out it wasn’t long before tens of thousand people had interacted with it from community health workers to parents to girls. And sitting back in my office in Nairobi, the numbers were what struck me: interviews on the order of tens, users on the order of tens of thousands. Design efforts on the scale of weeks, effects on the scale of years. I could see the trees but not the forest. I looked at service delivery numbers but they didn’t make any sense to me. I realized that I had no bigger picture and no idea of how to draw one or even what a bigger picture might look like. As I looked at some of our partners, the public health and development organizations with whom we worked, I gleaned a clue of what I needed. What I needed was data and the sort of literacy that would allow me to interpret it.
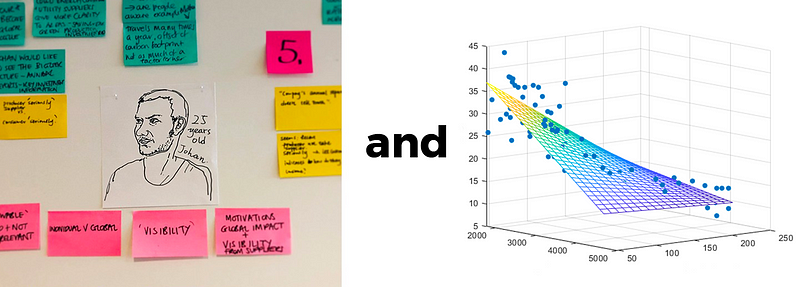
There are a few phases of preparing to design something and one of those, and arguably one of the most important, is design research. This research process means understanding who you’re designing for, what you’re designing to do, and how that thing works. That research also means understanding how well your design works out in the world once it’s been built, launched, rolled out, inhabited, and so forth. I was taught how to do this in a largely qualitative fashion at CIID and then working with frog, Teague, and IDEO. We conducted interviews, we took lots of pictures, we wrote lots of post-its, we built personas, days-in-the-life, user needs, a wide range of tools that helped us understand the who and the how.
As I’ve been thinking through how that experience and understanding maps to what I’ve been learning and working on lately, I’ve found that for many of these qualitative approaches to research, there’s a corresponding and complementary quantitative approach. Some of these can be run concurrently and some of them flow into one another in a linear fashion. Researchers often refer to this as triangulation: using different research methods and approaches to understand a context, population, or problem from multiple sides which each have strengths and blind-spots.
For instance, we want to understand who our users are. On the qualitative side of things we might start by establishing some core geographies or locations in which we’re interested, develop screeners for qualifying characteristics for interviewees, do baseline interviews with other experts, start writing an interview guide. On the quantitative side of things we’d want to establish our population, figure out what kind of sampling might generalize well, devise some data collection strategies, start thinking about reliable and valid measures that tell us what we might want to know about our population and what statistically measurable characteristics might define them. Both of these give us important insight into who we might want to talk to and how we might find them. On the qualitative side, these activities might lead into guided interviews or focus groups that generate a transcript, key insights, and lead to the development of personas. On the quantitative side you’d do your sampling, examine that sample for sampling bias, and then perhaps a survey or a standardized interview that identifies some key numerical and categorical data. One might also take all those interview transcripts and run some text summarization, some entity extraction, or some other NLP techniques to give us a broader overview of what was said.
Once we have an idea of who we’re interested in and what’s important to them, we might look to see how we can conduct observational studies. We’d want to know how our users think. On the qualitative side this might be an observational study. Techniques borrowed from Ethnomethodology might come in handy, maybe you’re thinking about a users daily routine and that could lead you to use participatory map drawing activities. On the quantitative side we might want to do a task completion study or some form of light field experiment like an A/B test or an Random Control Trial based survey. Maybe Discrete Choice Modeling that uses stated preference or even revealed preference depending on what our population and our data collection methods could help us see the how and the why of some of our users behavior. We could also take a page from the econometrics side of things and do a literature review for natural experiments that might allow us to run different kinds of regressions.
Once we have a better picture of who are users are, we’d probably be interested in how our product or service might be used. If we’re working on something more service-oriented, we’d probably want some sort of service design blueprint and we might create user journey maps and stakeholder maps. On the qualitative side, particularly in the public health or development world, we might develop a theory of change where we have our inputs, outputs, outcomes, and impact. We’d then propose causal pathways between each of those stages and try to tailor our program to address those. On the quantitative side we might structure a Causal-Comparative program where we identify a categorical independent variable and possible dependent variables. We could think about how a more in-depth RCT or a Correlation program might help us understand how our product or service should be designed. If we’ve run well-structured field experiments or happened to locate a natural experiment then we might be able to use Instrumental Variables Estimation to identify the importance of specific statistics and factors.
Once we’ve got a design or a rough notion of what we’d like to design, we’d want to assess it with users by doing co-design exercises; having them downselect designs, prioritize features, and define their own use cases. That might lead neatly into something that would give the opportunity to conduct a usability test, some sort of expectation survey or satisfaction questionnaire. From there, you might be able to conduct within-subject and between-subject tests with enough statistical power to say things about your designs with reasonable confidence. It’s easy to imagine how the qualitative approaches to evaluating designs might flow nicely into more quantitative methods and give a more complete picture of what it is and isn’t working.

Each can be good but both is (probably) better
Over my design career I’ve been watching my work scale up in terms of time, from small nearly throw-away websites and installation experiences to consumer products to aerospace and transportation to now looking at service designs and behavioral change initiatives that involve incredibly complex communities and systems and span multiple years. As the time scale and the complexity of the interactions and the inter-actors increases, the need to capture accurately the who, the how, and the why increases as well. That increase is what makes data an increasingly important part of the design process. I don’t know that there’s a neat trajectory or clearly defined path for me to follow in enacting this model of data-informed design but I'm sure that there's a lot of new tools and lenses for exploring, building, and testing in it. This new understanding of statistical analysis and machine learning has been a pretty profound step in my own understanding of how systems design, civic design, and more broadly human-centered design can be done in bigger and broader spaces.
For deeper reading on some of these topics, particularly the more quantitative ones, there's a few books that I can definitely recommend:
Field Experiments, Alan S Gerber, Donald P Green
Causal Inference, Scott Cunningham
Quantifying the User Experience, Jeff Sauro, James Lewis
Research Design, John Cresswell
Field Study Handbook, Jan Chipchase